
Mastering Trading View: Strategies to Enhance Your Market Analysis Skills
Introduction to Trading View and Its Key Features
In today’s fast-paced financial markets, having access to comprehensive, real-time data and advanced analytical tools is essential for traders and investors aiming to stay ahead. Trading view has emerged as a leading platform that combines sophisticated charting capabilities, social engagement, and market analysis into a seamless experience. This platform caters to both novice traders and seasoned market professionals, offering a suite of tools designed to enhance decision-making, strategy development, and market insights.
Founded with the goal of democratizing access to financial data, Trading View has established itself as an all-in-one solution. It allows users to track virtually all markets—stocks, cryptocurrencies, forex, commodities, and indices—while fostering an active community for sharing ideas and strategies. In this article, we will explore the core features of Trading View, guide you through setup and navigation, discuss advanced strategies utilizing its charting tools, and demonstrate how to optimize the platform for better market insights.
What Is Trading View and How Does It Serve Traders?
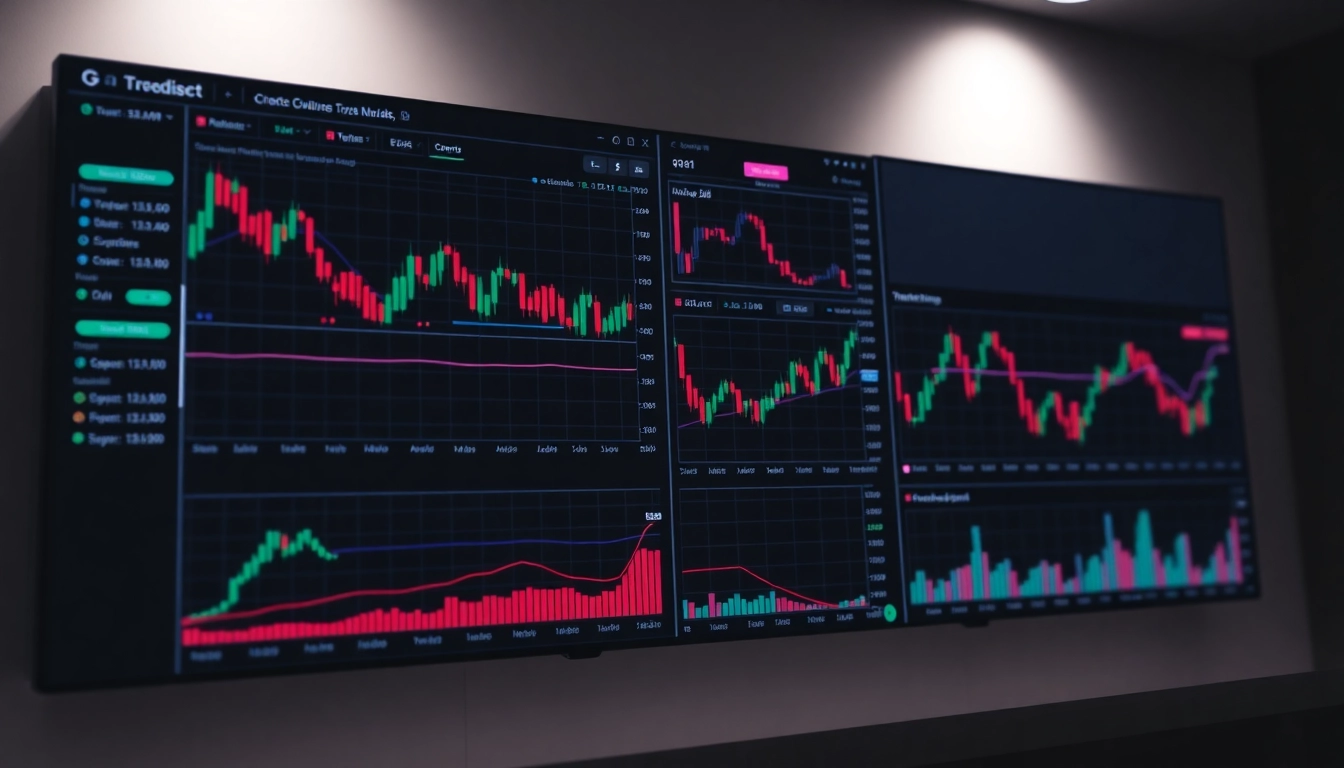
Trading View is a multi-faceted platform that serves as a powerful charting tool, a social network for traders, and a real-time market data provider. Available via web and mobile apps, it is designed to streamline market analysis, facilitate community engagement, and support trading execution through integrated brokerages. Its core strength lies in its ability to bring together market data from global exchanges and provide customizable, interactive charts accessible to traders at all levels.
By leveraging Trading View, traders can perform detailed technical analysis, conduct fundamental evaluations, and keep abreast of market sentiment. Its intuitive interface and wide array of features make it easier for traders to identify trends, entry and exit points, and potential reversals—vital components for successful trading strategies. Additionally, its social features allow users to share ideas, collaborate, and learn from a global community, fostering a rich environment of shared market intelligence.
Whether you are analyzing stocks, cryptocurrencies like Bitcoin, or forex pairs, Trading View provides a comprehensive platform that consolidates data, analysis tools, and social interaction into a single, accessible interface.
Overview of Fundamental and Technical Analysis Tools
One of Trading View’s standout features is its extensive suite of analysis tools that cater to both fundamental and technical traders. Fundamental analysis tools include access to economic calendars, news feeds, and company financial statements, which help traders assess the intrinsic value of securities. Technical analysis is where Trading View truly shines, offering hundreds of indicators, overlays, and drawing tools that assist traders in uncovering market patterns and signals.
Popular technical indicators available on Trading View include Moving Averages, RSI (Relative Strength Index), MACD (Moving Average Convergence Divergence), Bollinger Bands, Fibonacci Retracements, and more. Users can customize these indicators to suit their trading style and strategy. Additionally, drawing tools such as trend lines, channels, and shapes enable precise marking on charts for pattern recognition and trend analysis.
Advanced traders frequently combine multiple indicators and overlays to develop and refine their trading strategies. For example, a trader may use Fibonacci support levels in conjunction with RSI signals to identify potential reversal zones, leveraging visual cues from the platform’s robust charting capabilities. The ability to save and export chart setups streamlines repeated analysis and strategy backtesting.
Understanding Trading View’s Social and Community Features
Trading View’s social features set it apart from traditional trading platforms. The platform functions as a social network where traders can publish their ideas, share analysis, and discuss market developments. Community ideas—publicly shared charts and annotations—serve as an invaluable resource for learning and discovering different trading approaches.
Engagement occurs through comments, likes, and follows, fostering a dynamic environment of collaboration and peer review. For novice traders, observing community ideas can accelerate learning and aid in developing analytical skills. Conversely, experienced traders can showcase their expertise, build a following, and even monetize their insights.
Furthermore, Trading View’s live chat and group chat features facilitate instant communication among traders worldwide, enabling real-time market discussions. Integration with social platforms such as Twitter extends the reach, helping traders stay connected beyond the platform.
Getting Started with Trading View: Setup and Navigation
Creating an Account and Customizing Your Workspace
Getting started with Trading View is straightforward. Begin by creating a free account, which unlocks a range of features, or explore premium options for advanced tools and increased data access. Once registered, you can customize your workspace by arranging charts, watchlists, and news feeds to suit your trading style.
Personalization includes selecting color themes, configuring layout panels, and saving workspace setups. These customizations improve workflow efficiency and create a tailored environment conducive to focused analysis.
Navigating Core Charts, Watchlists, and Alerts
The primary interface displays interactive charts that can be enlarged and tailored with various indicators. Watchlists allow you to monitor selected assets at a glance, with the ability to add and organize symbols efficiently. Alerts are one of the platform’s most powerful features—set up for price levels, indicator signals, or news events—to ensure timely notifications that keep you engaged with the markets.
Using the toolbar, traders can quickly switch between timeframes, chart types (candlestick, line, bar), and drawing tools. The toolbar also includes shortcuts for accessing screener tools and social features.
Utilizing Mobile and Desktop Apps for Seamless Trading
Trading View offers synchronized apps for desktop (Windows, Mac) and mobile devices, enabling traders to access their setups anytime, anywhere. The apps provide nearly identical functionality to the web platform, including real-time alerts, charting, and social interaction. This flexibility ensures traders can react promptly to market moves regardless of their location, making it a versatile tool for active traders and investors on the go.
Advanced Trading Strategies Using Trading View Charts
Implementing Technical Indicators and Drawing Tools
Advanced traders utilize a combination of indicators and drawing tools to develop precise entry and exit strategies. For example, using Moving Averages helps identify trend directions, while oscillators like RSI can reveal overbought and oversold conditions. Drawing trend lines, channels, and chart patterns such as head and shoulders or double tops/bottoms facilitate visual recognition of key market signals.
Practicing multiple indicator overlays, like Bollinger Bands with MACD divergence, can improve signal accuracy. Building custom templates and saving them allows for quick deployment across multiple assets, streamlining analysis and decision-making processes.
Backtesting Strategies and Analyzing Market Trends
Trade strategies are most effective when validated through backtesting. Trading View allows users to simulate trades based on historical data, testing their criteria against past price movements to evaluate performance. This process aids in refining strategies, reducing risk, and boosting confidence.
Market trends can be analyzed using multi-timeframe analysis and the platform’s economic event calendars. Combining fundamental news with technical signals enables traders to anticipate major moves and manage risk more effectively.
Integrating Trading View with Broker Platforms for Live Trading
For direct execution, Trading View integrates with select brokerages, allowing users to place trades directly from the chart interface. This integration minimizes latency, improves order execution, and consolidates analysis and trading into a singular workflow. To set this up, traders need to connect their broker accounts and customize trade parameters within the platform.
Optimizing Trading View for Better Market Insights
Utilizing Screeners and Custom Indicators
Market screener tools are vital for filtering assets based on technical and fundamental criteria such as volume, volatility, and trend strength. Trading View’s built-in screeners facilitate quick identification of promising trading opportunities across various markets.
Custom indicators—created using Pine Script—allow traders to develop unique analytical tools tailored to their strategies. Sharing these scripts with the community can also generate insights from a diverse array of market perspectives.
Setting Effective Alerts and Notifications
Effective alerts are crucial for timely decision-making. Trading View enables users to set price alerts, indicator crossovers, or news-based triggers. These alerts can be delivered via email, SMS, or push notifications, ensuring traders remain informed without constantly monitoring screens.
Strategic use of alerts reduces missed opportunities and alerts traders to potential reversals or breakouts, especially in volatile markets.
Monitoring Multiple Markets for Diversified Trading
One of Trading View’s strengths is its capacity to monitor numerous markets simultaneously. Setting up multiple watchlists and custom dashboards allows diversified portfolio management and risk mitigation. Traders can observe correlations, divergences, and relative strength across assets, aiding more sophisticated trading decisions.
Measuring Success and Improving Your Trading Performance
Tracking Key Performance Metrics on Trading View
Trading View provides metrics such as winning ratio, profit/loss, and drawdown analysis within its Trading Panel. These statistics help traders evaluate the effectiveness of their strategies and adjust accordingly.
Regular review of these metrics encourages disciplined trading, prevents emotional decision-making, and fosters continuous improvement.
Analyzing Community Ideas and Market Sentiment
By studying community ideas, traders can gauge market sentiment, identify trending strategies, and discover emerging assets before they gain mainstream attention. The social hub exposes traders to diverse perspectives and helps validate personal analyses.
Combining these insights with personal analysis creates a holistic approach, improving prediction accuracy and strategic edge.
Continuous Learning: Updating Strategies with Trading View Insights
Markets are dynamic and require ongoing adaptation. Trading View’s real-time data, community feedback, and flexible analysis tools support continuous learning. Maintaining an evolving strategy, rooted in data and validation, ensures long-term trading success.
Participating actively in community discussions, experimenting with advanced indicators, and backtesting new setups are best practices for staying competitive.